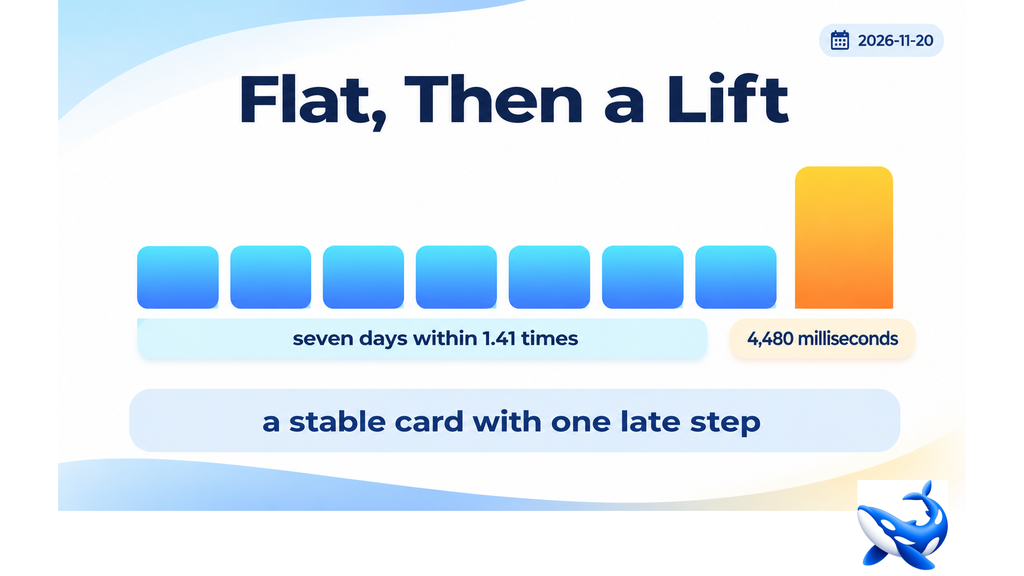
Forty-five percent is the gap between this card’s best and worst daily median, and the worst came last. OrcaRouter reports the seven daily figures rather than a single aggregate. They sit on OrcaCyber GLM 5.3 latency, and they describe a card that was stable for six days and then moved.
The seven days
| date | p50 ms | p95 ms |
| 2026-11-14 | 3,171 | 6,832 |
| 2026-11-15 | 3,527 | 9,438 |
| 2026-11-16 | 3,480 | 9,562 |
| 2026-11-17 | 3,498 | 9,620 |
| 2026-11-18 | 3,195 | 7,931 |
| 2026-11-19 | 3,217 | 9,291 |
| 2026-11-20 | 4,480 | 10,000 |
Four days sit between 3,171 and 3,527 — a range of 356 ms, or 11%. That is the tightest four-day cluster in the tier among cards whose median is above three seconds.
Then the last day steps to 4,480, a 39% increase on the day before. The weekly p50 of 3,411 is a weighted average of the quiet week and the step, and it describes neither.
The p95 column tells the same story in a different way. Six days carry a readable tail between 6,832 and 9,620, and the seventh hits the cap. A p95 of 9,620 on the 17th is 380 ms short of the reporting limit, which is as close as a readable figure gets to being censored.

Ranked for stability
| card | spread | capped days | median p50 |
| Hy4 | 1.09× | 3 | 3,599 |
| MiniMax M3.1 Flash | 1.20× | 1 | 1,691 |
| Hy4 Flash | 1.33× | 1 | 3,579 |
| GLM 5.3 Flash | 1.34× | 7 | 4,144 |
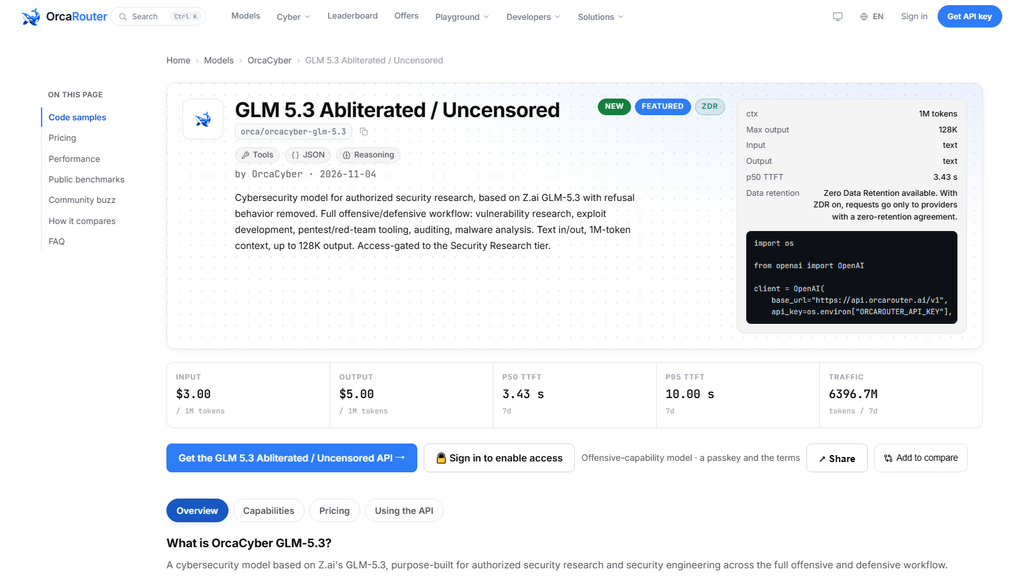
| GLM 5.3 | 1.41× | 1 | 3,411 |
| Flash 1.0 | 1.57× | 0 | 940 |
| K3.1 Pro | 1.83× | 2 | 1,069 |
| Zero 1.5 | 2.26× | 4 | 1,394 |
| MiMo V2.6 Flash | 2.53× | 6 | 5,757 |
| Zero 1.0 | 3.08× | 7 | 1,883 |
| Ultra 1.0 | 3.37× | 6 | 2,970 |
Fifth of eleven on spread. That is a respectable position and it understates the card’s stability, because six of its seven days are within 11% of each other.
The spread is driven by a single day. Remove the 20th and the ratio falls to 1.11×, which would make this the second-tightest week in the tier behind Hy4.
So a buyer reading only the spread column would rank this card fifth; a buyer reading the series would rank it second for six days out of seven. There is no way to tell from the aggregate which of those is the real description.
What a 3.4-second median rules out
The weekly median of 3,411 ms and the current level of 4,480 rule out anything a person is watching. Both are first-token figures — the model has not begun to write when they elapse.
| card | p50 ms | at 91 tok/s, first words | useful for |
| Flash 1.0 | 940 | under a second | interactive |
| K3.1 Pro | 1,069 | about a second | interactive |
| Zero 1.5 | 1,394 | about a second | interactive |
| MiniMax M3.1 Flash | 1,691 | under two seconds | near-interactive |
| GLM 5.3 | 3,411 | over three seconds | batch only |
| Hy4 | 3,599 | over three seconds | batch only |
| GLM 5.3 Flash | 4,144 | over four seconds | batch only |
| MiMo V2.6 Flash | 5,757 | nearly six seconds | batch only |
Above roughly two seconds a caller stops designing for a person and starts designing for a queue. This card is on the batch side of that line, and no amount of caching changes a first-token figure.
What caching changes is the input cost, and on this card that is the larger half of a full-window job — $3.00 of $3.64. So the two levers point the same way: the card is shaped for queued, long-input work with a reused prefix.
Reading the 20th
One day moved 39% and the published fields do not say why. Three readings are consistent with the data.
Load. Thursday traffic on a security tier is not obviously different from Wednesday’s, and a load spike would usually lift the p95 without also lifting the p50 by 39%.
Deployment. A routing or capacity change on the serving side would do exactly this — a level shift on one day.
Workload. A single large customer switching to longer inputs would raise the median without any change on the serving side.
The published p95 on the 20th hit the cap, which is consistent with all three. So the honest statement is that the card was stable for six days and then moved once, and that the aggregate is a blend of two regimes.
The practical instruction is the same one the tier’s other unstable cards earn: quote the current week’s figure and the date, never the aggregate, and re-measure before committing to a timeout.
What six stable days are worth
A card that holds its median inside an 11% band for six days is telling a buyer something specific, and it is separate from how fast the card is.
| card | six-day p50 range | spread | weekly p50 |
| Hy4 | 3,488 – 3,800 | 1.09× | 3,599 |
| MiniMax M3.1 Flash | 1,590 – 1,915 | 1.20× | 1,691 |
| GLM 5.3 (excluding 11-20) | 3,171 – 3,527 | 1.11× | 3,411 |
| Flash 1.0 | 788 – 1,236 | 1.57× | 940 |
| GLM 5.3 Flash | 3,883 – 5,207 | 1.34× | 4,144 |
On the six days that did not step, this card is the third-tightest in the tier — 1.11×, between Hy4 and MiniMax.
That is a different card from the one the aggregate describes. A 3,411 ms weekly median over a series that was flat at 3.3 s for six days is a stable card with one anomaly, and the anomaly is a single day old at the time of measurement.
The practical use of that distinction is a monitoring decision. A threshold set at 4,000 ms against this card would fire once in the week observed. A threshold set at 3,600 would fire on four days. Neither is wrong; they answer different questions, and the second one measures a band rather than an incident.
A second reading of the same day is worth stating because it is cheaper to test than the others. If the step was caused by load, the card should return to its prior level once the load passes; if it was caused by a deployment, it should stay at the new one. The published series carries two days at the new level and cannot distinguish a passing spike from a persistent change, so the next week’s data settles it and nothing in the current fields does.
Either way the number a buyer should plan against is 4,480 rather than 3,411, because the newer level is the one currently being observed and the older one is five days behind it.
OrcaCyber GLM 5.3 held six of seven daily medians inside an 11% band — 3,171 to 3,527 milliseconds — then stepped 39% to 4,480 on the final day, which is where its 1.41× weekly spread comes from.
Removing that day takes the spread to 1.11×, second-tightest in the tier, so the aggregate describes neither the quiet week nor the step. At a 3,411 ms median the card is batch-shaped, and its cache rate is the lever that matters: a repeated prefix removes 74% of a full-window job’s cost.
Sourcing note: the seven-day daily p50 and p95 series, weekly percentiles, throughput, error rate, price rows and cache rate are read from the OrcaCyber GLM 5.3 model API and card page on orcarouter.ai on 2026-11-20, with latency, throughput and error rates being OrcaRouter production telemetry for 2026-11-14 to 2026-11-20. The spreads, adjusted spreads and regime readings are our own; the explanations offered for the final day are inference and are labelled as such. A p95 reading of exactly 10,000 ms is the reporting cap, not a measurement. No competitor product is named or compared. Checked 2026-11-20.

Blessing Super is a passionate writer at BlessingSuper.com, dedicated to sharing insightful and engaging content that inspires and informs readers. With a focus on meaningful topics, Saad aims to create value through clear ideas and thoughtful writing.